Last week, I was able to implement a technique on 7T fMRI data I collected within the Tong lab using a rotating wedge as visual stimulus presented to the participant.
As visual areas have retinotopic organization, meaning that they contain complete maps of the visual field, we can use this approach to determine boundaries between those visual areas.
Polar angle values of the wedge with highest correlation with fMRI signal were determined in each voxel and were used to define visual region boundaries in the cortex.
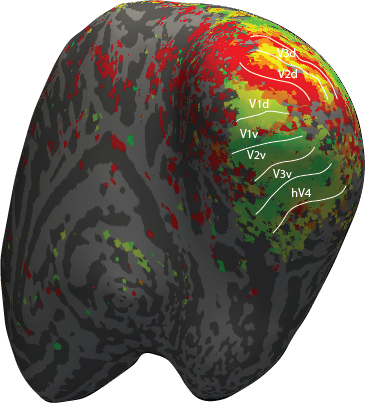
As you can see in the image above of the inflated surface of a right hemisphere with angular values of highest correlation within each voxel of the occipital regions, the red color would correspond to the lower part of the vertical meridian in the visual field and the dark green color would correspond to the upper part of the vertical meridian.
More about retinotopy:
Wandell, B. A., Dumoulin, S. O., & Brewer, A. A. (2007). Visual field maps in human cortex. Neuron, 56(2), 366-383.